
We’ve had close polls in past American Presidential elections, and we had close polls in this year’s election. We often quickly forget about polls once an election is over, turning our focus instead to transitions and candidates-elect. And, most of the time, the polls were right. This year, not so much.
What happened? A perfect storm of high expectations, skimping on resources, and applying the same assumptions to a changing society occurred. Let’s dive in.
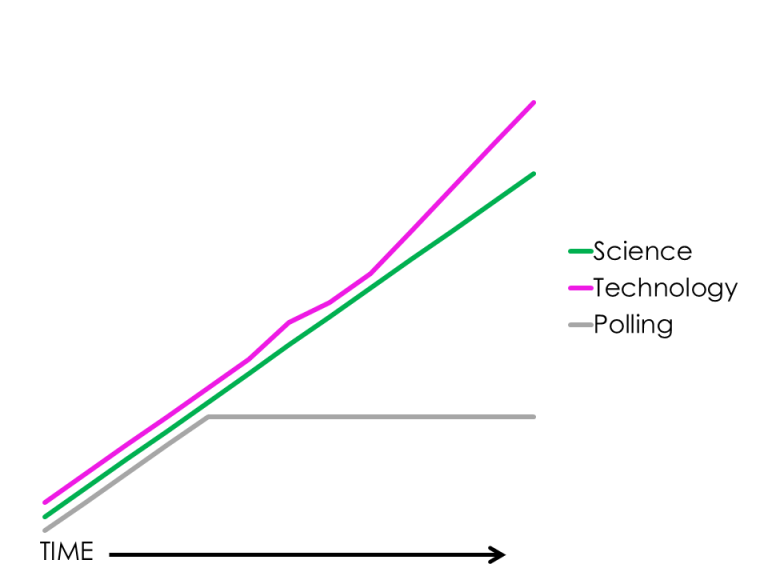
Broadly speaking, technology and science have experienced increasing gains over time. (See graph). We know that and expect that as a society. We lump polling into our definition of science, and collectively expect that it, too, will increase in correctness and sophistication. But election polling isn’t perfect, and behavioral science doesn’t always follow the rules of hard science. Some of the polling industry’s early assets have plateaued or betrayed them (land line home phones with people who answer them), leaving Americans scratching their heads. Such a plateau doesn’t match Americans’ always-increasing, ever-achieving definition of science, and is confusing.
It takes time and money to do a poll correctly. Did I mention time? That’s something we’re short on in a Presidential campaign – we want to know now how that candidate did in last night’s debate, and we want to know now how the other candidate is looking days before a primary. But completing a truly representative sample in a poll can’t be done overnight. Often campaigns walk a tight line above an endless pit of spending money on polling, advertising, donor outreach, and 235 other campaign expenses.
This year’s race seemed to especially highlight that some polls asked the wrong questions. Anecdotally, I heard that someone was asked, “On a scale of 1 – 10, how much do you hate Hillary?” Without even going into all the things wrong with this question (leading the respondent, bias, etc.) we can clearly state that hate for Hillary may or may not predict how someone votes. Was the nuance of such a difference reported by the media? Or was the outcome rotely reported as a headline?
Also highlighted this year, polls seemed to be non-representative and talked to the wrong people. They didn’t ask the right people the right questions. Did they poll rural Pennsylvania voters, or just Pittsburgh and Philadelphia voters? Polling’s old assumptions about representativeness related to race, ethnicity, and sex are known and given care. But the lesson this year was loud – new categories in representativeness of socio-economic status and urbanicity were not to be ignored. A canyon of difference in Presidential preference divides rural and urban voters.
As well, we saw many first-time voters. First-time voters often aren’t polled. See “Resources” above – it’s cheaper to poll previous voters – we know who they are, where they live, and their phone numbers. If first-time voters are a significant chunk of voters, and have different views than previous voters, this can nullify old statistical weights and predictive assumptions.
This seemed to be a year of liars and mind-changers. Although we are absent hard science on this given the newness of the election, some experts claim that this year, more than ever, people lied to pollsters. While there is evidence that most people don’t lie on surveys, this year’s election rules seemed to go out the window. Given the stark divisions and contentiousness of this election, respondents who lied to pollsters may have swayed poll results by a percentage point or two.
We also know that many people changed their mind throughout the campaign. We had many undecided voters – another sub-group that added error to predictions. When polls don’t ask the same person about their preferences throughout the life of the campaign, mind-changing isn’t captured in a prediction. Error.
I hate to break this to you, but statistical methodology is an art form. It requires a nimble statistician making a series of small decisions constructing an analytical path towards an outcome. These paths can vary from statistician to statistician – sometimes resulting in the same outcome, and sometimes not. Much attention has been given to the USC Dornsife/LA Times Daybreak Poll that correctly predicted the Presidential election winner. This poll used different weighting methods than other polls – not right or wrong, just different, as art is.
As I’ve called for before, we need data journalists. This is worth repeating – we need data journalists, please! We are desperate for the statistical literate with amazing communication skills to help us understand the math behind our world.
It isn’t just us. Take heart – we Americans are not alone this year. The UK polls wrongly predicted the outcome of the Brexit vote, and pollsters in Columbia incorrectly predicted that Columbians would accept the peace deal with the FARC.
With all this, we statisticians are seeking to learn lessons. The American Association of Public Opinion Research released this statement on their road to lessons learned, and members of the American Statistical Association are having a lively internal discussion on the polls.
Polling, prediction and estimation help clarify our confusing world, but can’t always bring it entirely into focus. We need to collectively grasp that uncertainty exists. Polls are surveys of a sample, and nothing more. If they were more, we wouldn’t need to actually vote.
 Thanks for visiting FirstEval. Please reach out if you'd like to talk about your data.